Inequaligram

What do millions of social media images shared in New York, Bangkok, Sao Paulo or London tell us about each city? Which parts of a city receive most attention and which remain invisible? How can we quantify and measure these patterns? Do locals and visitors share most images in the same areas? How does this activity change between daytime and nighttime?
Every world city has large inequalities in income, wealth, education, social well-being, and access to services. Social media sharing adds new inequalities. In some parts of the city people share many images that show their experiences and places they visit. In other areas, they share much less. In this way, some parts of a city become “social media rich” while others remain “social media poor.”
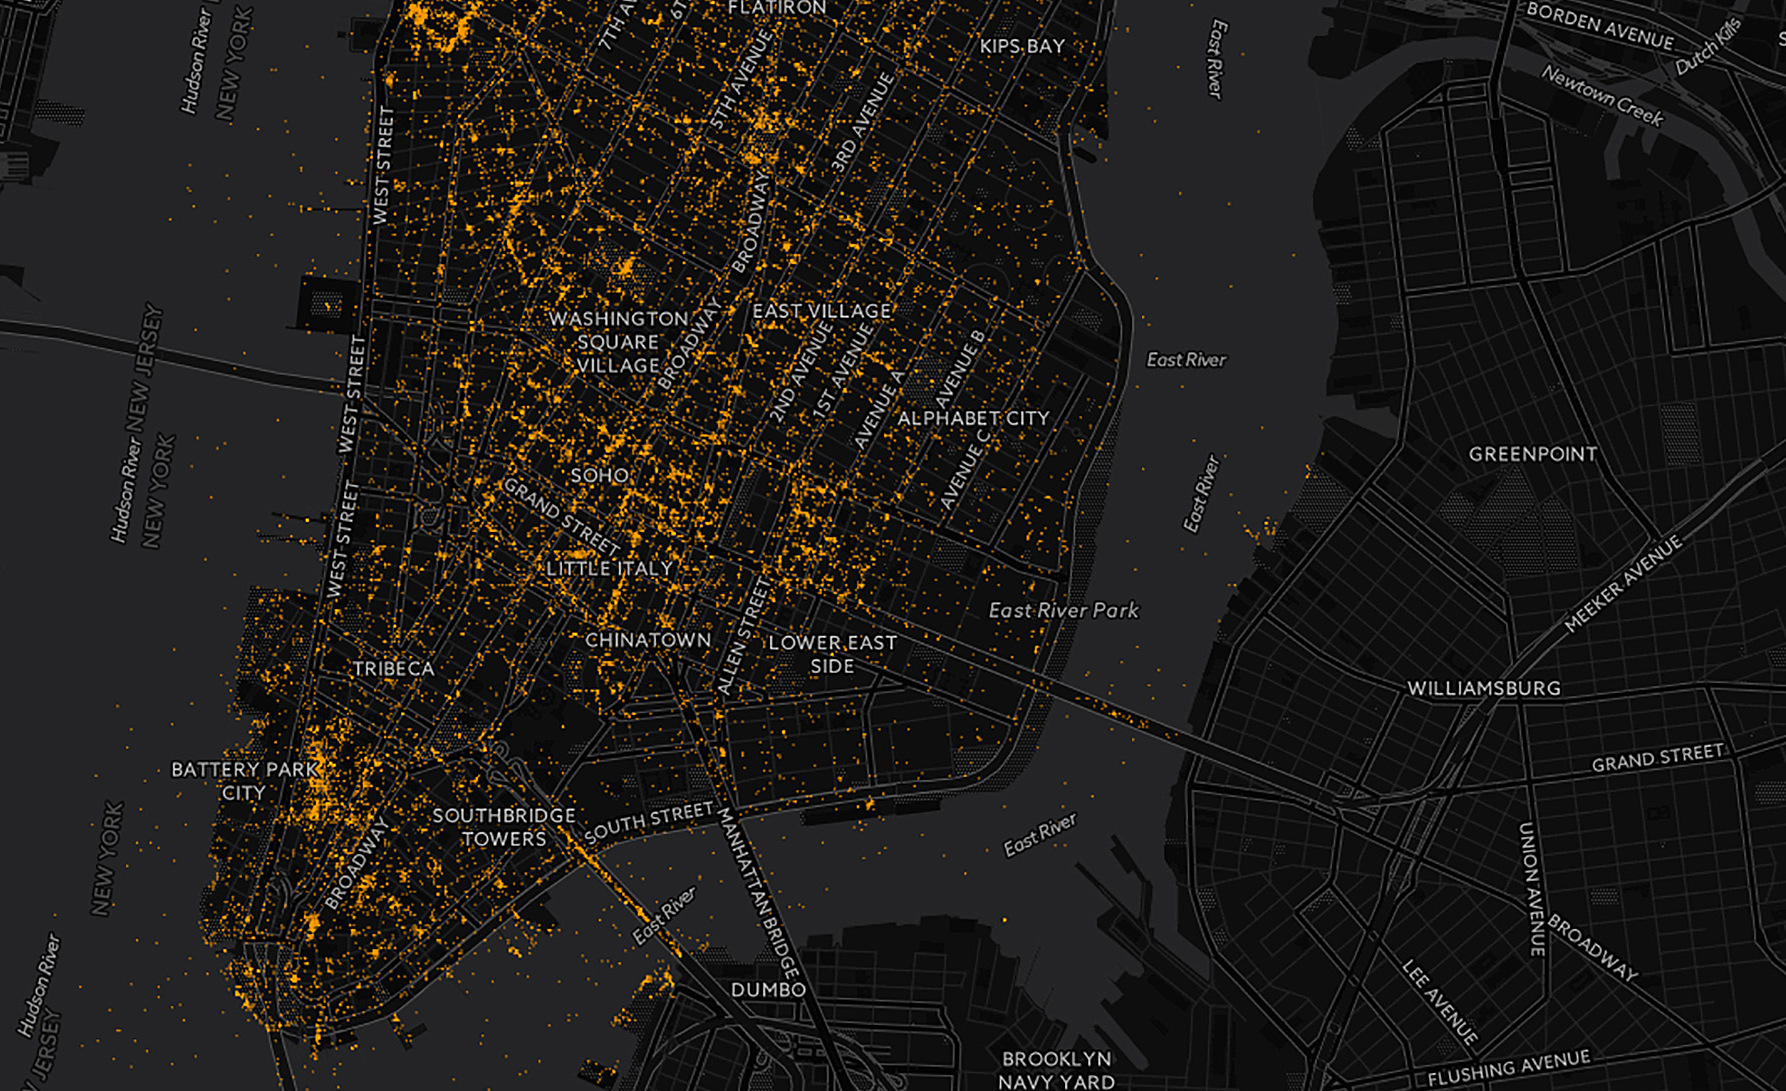
Inequaligram project analyzes 7,442,454 public Instagram images shared in Manhattan over five months. We use measures of inequality from economics to understand differences in sharing between parts of a city.
The ratio between a Census tract with most images and the tract with least images is staggering: 250,00 : 1. The inequality of Instagram images by locals turns out to be bigger than inequalities in levels of income, rent, and unemployment. The inequality of visitors' images is larger than income inequality in the most unequal countries.